

¿Por qué los sistemas industriales necesitan anticongelante/refrigerante en verano?
1405/03/02
Pasos para la limpieza química de torres de refrigeración: guía de implementación
1405/02/07
Tipos de sedimentos en sistemas de ósmosis inversa y métodos para identificarlos.
1405/02/05
Beneficios de utilizar soluciones especializadas de Abrizan Company para MED
1404/12/09
Investigating the growth control of microorganisms in the cooling tower using three biocides

Investigation and comparison of the effective control of the growth of microorganisms and algae in the DM cooling tower water environment using the performance of three anti-biofouling (biocide) solutions
Abstract:
The activity of living organisms such as aerobic and anaerobic bacteria, algae and other microorganisms and their excessive accumulation in the industrial water environment make the water conditions unfavorable for these uses. These organisms, which are able to continue their life in a wide range of pH, temperature, and pressure, will cause great damage if they are not removed or their growth is not controlled. Therefore, a method must be used to get rid of the problems caused by these organisms and control their effective growth, the best of which is the use of anti-biofoulings or biocides.
These substances, with the ability to prevent the activity of some vital enzymes of bacteria, especially enzymes involved in respiration and glycolysis, lead to the release of the contents inside the bacterial cell into the surrounding environment and as a result, its death.
The aim of this study was to determine the effectiveness of three anti-biofouling solutions or biocides 0083, 0085 and 0096 (synthetic by Abrizan Company) in controlling the growth of microorganisms and algae in industrial water environments and to compare the efficiency and results of the effects of these substances. According to the data obtained in the study of all three biocidal solutions, a reduction in the amount of bacteria in DM water and control of the growth of microorganisms to less than 103 cfu/mL and a high removal of sulfate-reducing bacteria were observed. However, in controlling the growth and removal of algae, biocide 0096 was very effective.
Also, the effectiveness of this biocide at a specific concentration was expressed as the log reduction of microorganisms after a specific contact time with log5 for TBC, which indicates an approximate removal of 100 percent of aerobic bacteria using this biocide. In addition, the removal of over 99% of sulfate-reducing anaerobic bacteria was also determined by testing this biocide, which shows its efficiency and effect in controlling the growth of these microorganisms.
In addition to everything that was said for biocide 0096, several advantages of two biocides 0085 and 0083 can also be mentioned, including low toxicity and biocompatibility for biocide 0083 and a 99.9% reduction in sulfate-reducing bacteria for biocide 0085.
Pilot location:
Petrochemical Research and Technology Company site in Mahshahr Special Economic Zone
Introduction
Microorganisms (viruses, algae, bacteria, fungi, etc.) are important factors in the change and transformation of various substances in the world and can easily disrupt the performance of various industries and put an economic cycle into crisis. A very important part in organizations, factories, refineries, apartments and large buildings for heat dissipation is the cooling tower.
Since the basis of the work of all cooling towers in various industries is to create a greater contact surface between the hot water flow and the cold air and, as a result, heat exchange between the two, it is necessary to think of measures for the best efficiency. These measures should be aimed at purifying the water entering the cooling towers to prevent 4 consequences:
- Corrosion and erosion
- Scaling
- Problems caused by the formation of microorganisms
- Fouling
Cooling towers have the most favorable conditions for the growth of microbes, since their nutrients and factors such as organic matter, mineral salts and sunlight are abundant there. It is an important fact that microorganisms, like minerals, will also condense in open evaporation systems, although this multiplication will not have much effect by numerical expansion compared to the natural microbial reproduction cycle which is logarithmic. In a cooling tower, while the concentration of minerals may increase sixfold in a given period of time, it is conceivable that the concentration of bacteria will reach six million in the same period.
Problems caused by the growth of microorganisms in cooling towers
- Microbial debris generated by heat transfer
- Localized corrosion due to microbial problems
- Reduced corrosion inhibitor effect
- Clogging due to trapped microbial debris
- Reduced water flow and distribution in the cooling tower
In many microbial problems that occur in industries, the effect of microorganisms such as algae and fungi is evident, but a large percentage of the biological corrosion seen in these industries is due to the presence of bacteria.
Algae growth depends on environmental conditions. It is more common in shallow water because in deeper water there is no surface for organisms to attach to. Also, when the water is warm, macroscopic organisms reproduce rapidly. These organisms adhere to smooth, hard surfaces but not to rough surfaces. In closed systems, various toxic anti-algae agents are used to eliminate these organisms (algae, etc.). These methods are more or less successful depending on the conditions.
Some Problems Caused by Algae Growth in Cooling Towers
- Algae can harbor pathogenic microbes such as Legionella and cause health problems.
- Algae (sludge) build-up and the growth of organisms in it can lead to heat exchanger fouling and loss of cooling efficiency.
- Algae and fungal growth can block water flow, create an unsightly appearance, and damage cooling tower structures.
- Cooling towers also trap dust and microbes in the air. Dust contains nutrients to support the growth of microorganisms.
- Algae, through photosynthesis, corrode the cooling tower system.
- It clogs the water diffuser holes and prevents water from falling evenly over the tower packings.
- Phosphate in the water can promote algae growth, which can then feed on bacteria. The higher the biochemical oxygen demand (BOD) or total organic carbon (TOC) concentration in the cooling water, the greater the risk of increased biological fouling.
- Excessive amounts of algae can stick to the impellers of circulation pumps, increasing the pump amperage requirement.
- Dead algae may accumulate inside heat exchangers and provide a suitable food source for other microorganisms. In addition, they combine with deposits and corrosion products and coat the internal surfaces of the equipment.
As a result, they cause a difference in the oxygen content in that area and form a concentration cell in that area, thus causing pitting corrosion.
Therefore, under conditions where these organisms accumulate, in order to prevent clogging of the system and also to prevent corrosion, it will always be necessary to clean at regular intervals and use a means to control and eliminate algae growth.
As mentioned above, in addition to microorganisms such as algae, microorganisms that cause disturbances in cooling towers of various industries are bacteria. One of these important bacteria is sulfate reducing bacteria, which is responsible for most of the microbial corrosion in the industry.
If these bacteria are not removed from the system, they cause pitting corrosion and stabilization of anodic points, create an acidic environment under deposits, form sensitive spots on the metal, and galvanic corrosion between iron sulfide and steel. Their mechanism of action is the reduction of inorganic sulfate SO4-2 and its conversion to sulfide. These bacteria reduce sulfur compounds in anaerobic environments, and hydrogen sulfide is converted to sulfide by combining with iron and other metals. These bacteria are very common under anaerobic conditions such as wet clay, sludge, and swamps.
These anaerobic bacteria do not have a respiratory system and are not able to use oxygen as the final electron acceptor. Their activity has been reported at pH 5 to 5.9. Their optimal growth temperature is 20 to 40 degrees Celsius. SRB bacteria are usually divided into two main groups. Bacteria that are able to use lactate and those that are not able to do so. Those that do not use lactate generally use acetate and continue to grow and multiply by relying on other organisms and microorganisms that are able to produce the aforementioned substances.
These bacteria can also affect cathodic protection systems and increase the cathodic protection potential from -0.85 to -0.95, which is due to the effect of these bacteria on the reaction mechanism. Sulfur compounds produced by SRB bacteria killed thousands of fish off the coast of England in 1949, caused chemical burns in rice fields, and even poisoned workers, especially in places like sewage plants.
Like all bacteria, sulfate-reducing bacteria use specific chemical reactions in which phosphorus plays a key role to store energy, and as a result, in areas where SRB is active, there will be significant amounts of phosphorus, often in the form of non-crystalline compounds that are difficult to detect by X-ray. The presence of these bacteria also causes the gram-negative, non-spore-forming bacteria Legionella, which have been isolated from several water sources. This bacterium causes two diseases, Legionellosis and Pontiac fever, which are transmitted to humans through aerosols from water sources contaminated with this organism.
Cooling towers are commonly considered a source of disease outbreaks. Therefore, microbiological control of cooling system water is essential not only for the efficient operation of a system, but also to prevent the aforementioned problems, surface adhesion and cooling tower erosion. Therefore, the use of microbicides or biocides to prevent the growth of these species and, in parallel, regular cleaning of the operating system is mandatory. It should be noted that if they are not used in a timely and appropriate manner and in sufficient quantities, bacteria enter the system and their accumulation leads to bacterial colonies, in which case the penetration of microbicides into these colonies may encounter many problems.
Factors to consider in selecting a good biocide include:
- Type of microorganisms present
- Type of system (e.g., open or closed cooling systems)
- Operating history of the system
- Physical and chemical properties of the fluid
- Costs (economic studies)
- Environmental constraints
- Compatibility with system fluids and other chemicals present in the system Specific goals have been added.
There are three main methods for injecting these biocides or germicides:
- Impact injection
- Continuous injection
- Intermittent or intermittent injection
Impact injection refers to the injection of higher concentrations of germicide at regular intervals, continuous injection refers to the application of biocide at low but effective concentrations throughout the entire operating period of the system, and intermittent injection refers to obtaining effective concentrations at regular intervals of several hours.
Continuous and intermittent injection methods are usually used when the make-up water is completely contaminated, especially when the system is operated with less than 5 cycles, in which case impact injection can also be useful. Impact injection can be used in cases where contamination is less or the concentration cycles are higher.
Biocides can be divided into two main categories:
- Oxidizing Microbicides
- Non-oxidizing Microbicides
Oxidizing Microbicides should only be used in systems that use potable water. Types of these microbicides include chlorine, chlorine compounds including sodium hypochlorite, calcium hypochlorite or dry chlorine, chlorine dioxide, chloramines, and bromine.
Also, types of non-oxidizing microbicides include aldehydes (such as formaldehyde, glutaraldehyde, and acrolein), amine-like compounds (such as amines and diamines), halogenated compounds, sulfur compounds, and quaternary phosphonium salts.
The addition of microbicides is time-dependent so that the microbial population never reaches a logarithmic growth rate. It should be noted that if the following are not observed:
- The volume of water that will be in the system
- The amount of water that will be wasted from the system
- The severity of the microbial corrosion cases
- The effective concentration of the microbicide
- The appropriate contact time of the microbicide with the microbial mass
It is possible that due to the disruption of the balance of the microbial population, the factor of competition with other microorganisms will be eliminated and more resistant species and groups will begin to grow.
Solutions 0083, 0085 and 0096 of the Abrizan Research and Industrial Company are three improved formulations of a biocide combination based on isothiazolinone and glutaraldehyde and are synthetic and have been used so far to control microbiological activity, disinfection, environmental hygiene and water improvement processes. These compounds are designed as a result of natural reactions between macro-organisms and microorganisms, which, through the microbial community, have led to the development of various new strategies that neutralize the negative performance of biological pollutants.
The performance of these biocides in effectively controlling the growth of microorganisms and algae in industrial water environments has been investigated and compared in this study. How these behaviors are investigated in a simulated environment with cooling towers used in industries has been done by comparing the results of the TBC and SRB test kits in the presence and absence of biocide solutions.
Method of work
The general scheme of the pilot, which is a cooling tower with a capacity of 80 liters and was used to investigate the effective control of the growth of microorganisms and algae by anti-biofouling, is given in Figure (1). The water used in this pilot is DM water. Before starting the test, the test equipment must be cleaned to prevent contamination with residues from previous tests or undesirable microbiological contamination.
The environment for the growth and metabolism of algae, which is a photosynthetic organism, is provided by light, heat, and nutrients (limited amounts of phosphate). The simplest and most common method for determining the total bacteria in water containing algae and the presence of sulfate-reducing bacteria in DM water is to use a Total Bacteria Count (TBC) and Sulfate-Reducing (SRB) test kit.
The results of the test kits (TBC test kit after 48 hours and SRB test kit for a period of 1 to 8 days) were examined in the absence and presence of biocide and the extent of effective control of bacterial growth was reported by comparing the data in three occasions. Fresh water entering the cooling tower basin was also analyzed and its physical properties were measured (Table (2)).
Measurements were also made and reported regularly during the test (Tables (3), (4) and (5)). Then, the desired microbiocides were applied in order and the desired standard was used to check their efficiency in the cooling water system. To determine the number of microbial colonies and sulfate-reducing bacteria in the water, ASTM standards are used.
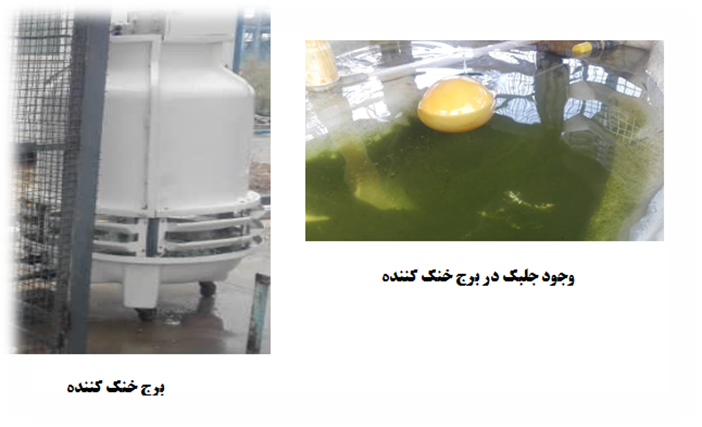
Figure (1): View of a cooling tower and algae formation inside the tower
Results and Discussion:
1-Controlling the growth of microorganisms using biocides
Calculating the number of bacteria and TBC test
Excessive accumulation of microorganisms, including bacteria, in all industries that deal with water, especially, can lead to the production of biofilms that cause numerous technical problems in the system and even change the production path in industries. The overall detection of these bacteria and their number in water gives us the opportunity to prevent their growth before they overgrow and create bulky biofilms. In this test, after detecting the total number of aerobic bacteria in the DM water of the cooling tower, the effective control of the growth of microorganisms in the water environment was examined in the presence and absence of biocides.
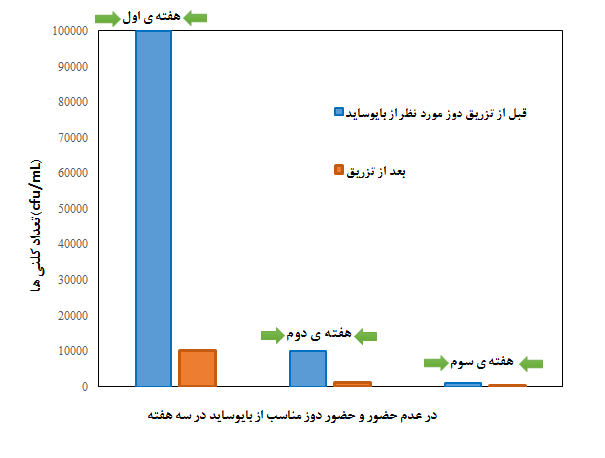
Figure (2): Investigation of the number of colonies and microbial contamination in DM water environment in the presence and absence of biocide 0085
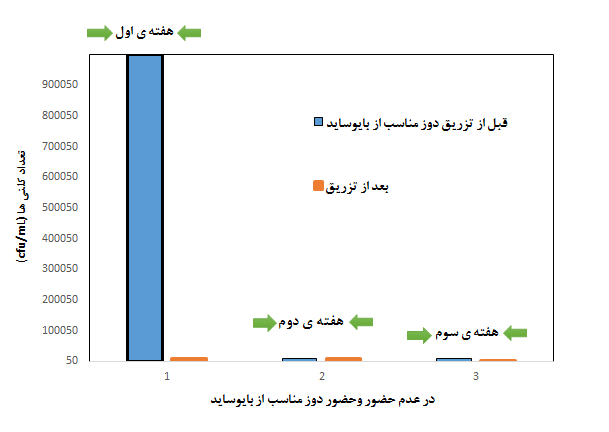
Figure (3): Investigation of the number of colonies and microbial contamination in DM water environment in the presence and absence of biocide 0083
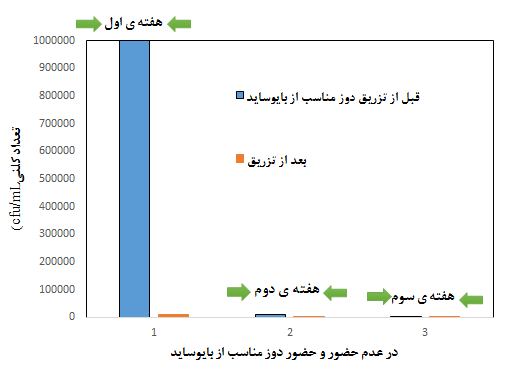
Figure (4): Investigation of the number of colonies and microbial contamination in DM water environment in the presence and absence of biocide 0096
The results of this test are shown in Figures (2), (3), and (4). As previously stated, the efficacy of the biocide in eliminating bacteria and algae in cooling tower water against
1) microbes present in the cooling system
2) microbes in biofilms of cooling water systems
3) microorganisms that are detectable and known to contaminate the cooling water system
The reduction of bacteria in the presence of the biocide in question can be interpreted as the biocide binding to the terminal group of the cell wall of the microorganism, fixing it and causing disruption of the synthesis of RNA and DNA for the growth of these microorganisms and causing coagulation and protein degradation and ultimately their death (Figures (5) and (6)).
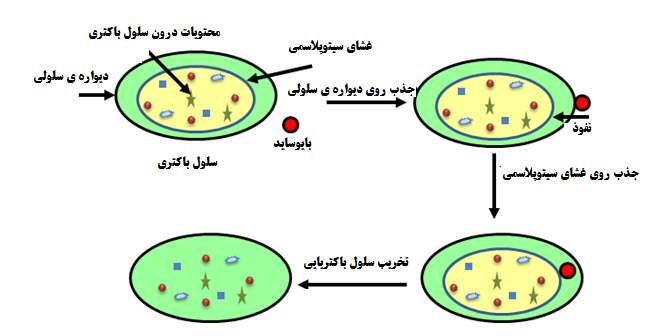
Figure (5): Mechanism of action of biocide on bacterial cell elimination
For example, the mechanism of action of glutaraldehyde-based biocide (0085) is presented as follows:
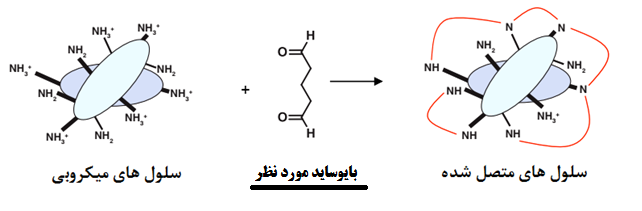
Figure (6): Mechanism of action of biocide 0085 on bacteria or microbial cells
The aerobic bacteria count sample with the formula provided in the test instructions in the first week, before the biocide injection, was considered as a control sample to calculate the biocide efficiency. To calculate the number of these bacteria, the TBC laboratory test kit was used, which is used to detect and calculate the total number of aerobic bacteria in the water sample. The steps of culturing and identifying the total bacteria present in the water using the kits are given in the report. In this method, a schematic pattern of the number of grown bacteria was used to compare with the results of the TBC test (Figure (7)).
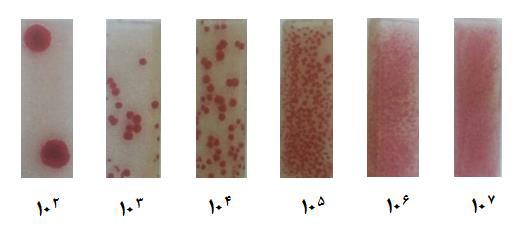
Figure (7): Schematic pattern of the number of bacteria grown for comparison with the results of the TBC test.
Sulfate Reducing Bacteria Count and SRB Test
As mentioned earlier, in addition to the TBC test kit, the SRB kit is also used to confirm the presence or absence of sulfate reducing bacteria in the DM water environment. In fact, the most important microorganisms that play a role in microbial corrosion (MIC) are these sulfate reducing bacteria. If these bacteria are not removed from the system, they cause pitting corrosion and anodic spot stabilization, create an acidic environment under the deposits, form sensitive spots on the metal, and galvanic corrosion between the sulfides of the two steels.
Sulfate reduction in these bacteria (Figure (8)) occurs according to the following reaction:
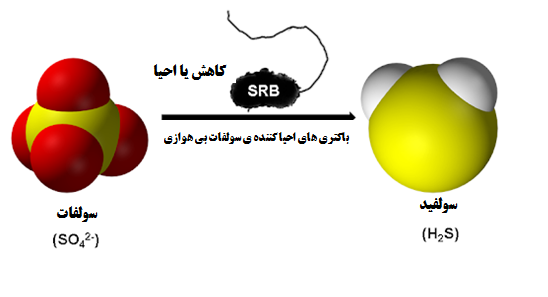
Figure (8): Reduction of sulfate to sulfide in sulfate-reducing bacteria
Usually, in the place of reduction and reaction, in most cases, there is iron, and the sulfide ion (S2-) formed reacts with iron and the corrosion product is FeS, which is black in color. These anaerobic bacteria are among the most important microorganisms that, if not removed from the water, will cause microbial corrosion (MIC) for the above reasons. In the test conducted, the efficiency of biocides to remove this bacteria has also been investigated. As can be seen in Figure (9), microbial corrosion has occurred through cathodic depolarization for sulfate-reducing bacteria at the iron electrode. Here, no biocide was present in the system.
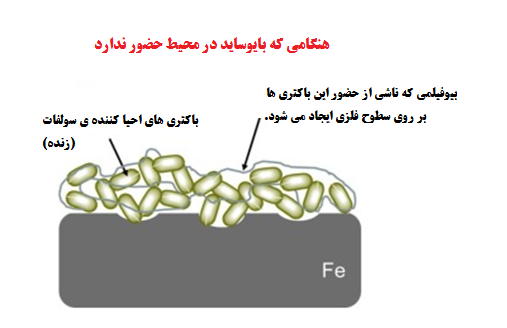
Figure (9): Microbial corrosion via cathodic depolarization for sulfate-reducing bacteria at an iron electrode in the absence of biocide.
By using biocides (as shown in Figure (10)), corrosion can be minimized. The mechanism of action is that the biocide can react with the bacterial thiol group (-SH) and affect DNA, RNA and protein synthesis. It can also cross-link or cross-link proteins and microorganisms in cells. Usually, the microbial cell wall is the target site for biocides to attack. The biocide can prevent pitting corrosion by the coating it forms on the iron surface and the effect it exerts on sulfate-reducing bacteria (Figure (10)).
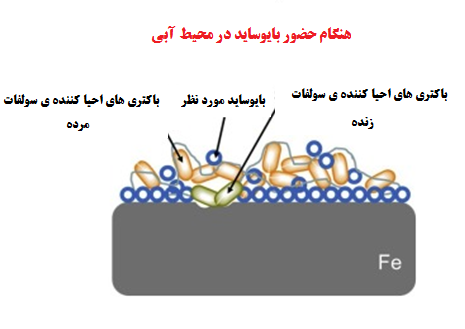
Figure (10): Reduction of microbial corrosion and elimination of sulfate-reducing bacteria as a result of the presence of biocide
The results of the test of the effective control of the growth of sulfate-reducing bacteria in DM water in the presence and absence of biocides are shown in Figure (11). For example, as can be seen, in the absence of biocide 0085, the number of sulfate-reducing bacteria in the first step was between 100-1000 and decreased to 10-100 with biocide injection, and in the next step with biocide injection, there was a decrease trend and reached almost the absence of bacteria in the third week.
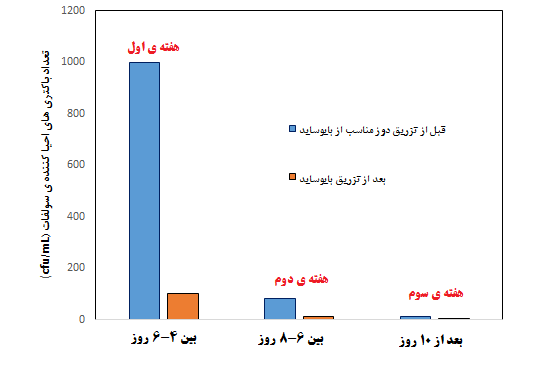
Figure (11): Investigation of the number of sulfate-reducing anaerobic bacteria and microbial contamination in DM water environment in the presence and absence of biocide 0085
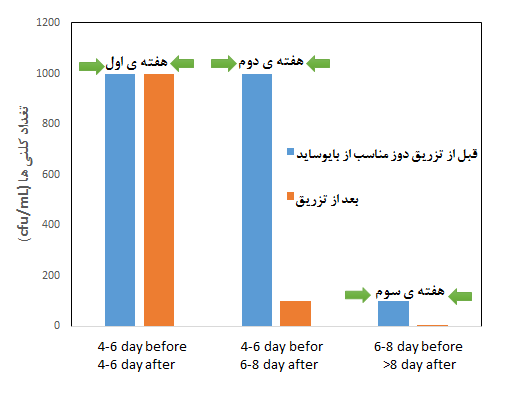
Figure (12): Investigation of the number of sulfate-reducing anaerobic bacteria and microbial contamination in DM water environment in the presence and absence of biocide 0083
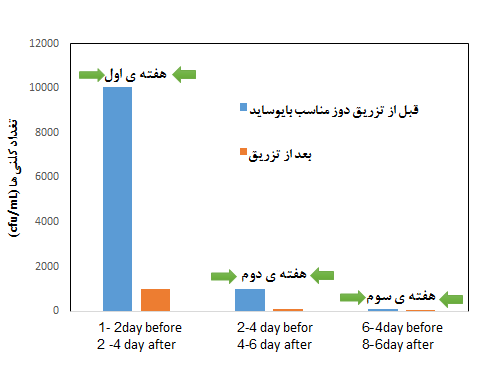
Figure (13): Investigation of the number of sulfate-reducing anaerobic bacteria and microbial contamination in DM water environment in the presence and absence of biocide 0096
2- Controlling Algae Growth and Removing It Using Biocides
Biomass control is also very important in cooling towers. Biomasses that may form in cooling towers include slime, which is gelatinous, and algae, which is green. Biomasses are living plants that generally feed on light and substances in water. If these biomasses are not controlled, their growth and expansion will block the water and air flow paths in the cooling tower, resulting in a decrease in the efficiency of the device. Chemicals must be used to control and remove these biomasses.
To remove biomass in this cooling tower, all three biocides were examined (it should be noted that excessive use of biocides can also cause the destruction of wooden parts and organic materials). If significant biomass growth and expansion is observed in the cooling tower, a high and shocking dose should be used to apply the biocide (in the first stage of biocide injection) to destroy all biomass. Then, a lower dose is applied intermittently, however, this amount should not exceed the permissible limit.
Biocide should be added to the cooling tower water with caution because it causes a sudden decrease in the pH of the cooling tower water and reduces corrosion resistance. Also, cooling tower water becomes toxic if biocide is added and must be drained with safety precautions and should not be used for watering plants. The growth cycle of biomass varies depending on the type and environment, which includes changes in pH, appropriate temperature, sufficient light and nutrients such as nitrogen and phosphorus.
Harmful biomass generally settles at the bottom of the water and it is necessary to clean and disinfect the bottom of the pan and the bodies. In the figures below, the amount of algae in the cooling tower before and after the injection of biocides can be seen. As mentioned at the beginning of the report, the resulting algae grew well as a result of the temperature and light conditions and nutrients, including phosphate, in the cooling tower for each test stage.
As can be seen, with the addition of biocide 0085 to the DM water environment during the test, only a very small part of the algae was destroyed and a very slight color change from green to yellow took place (the color change is most likely due to a change in the pigment composition of the algae, which may reflect a change in their physiological state (transition from the exponential phase to the stationary growth phase)) (Figure (14)). However, with the addition of biocides 0083 and 0096, we see the death of the algae and the control of their growth.
With the increase of biocide 0083 (Figure (15)), the algae form masses and accumulate on the bottom and body, and the color change of a larger part of the algae is also achieved due to the change in the pigment composition. Complete death of the algae and their severe color change were observed with the increase of biocide 0096, which indicated the lack of growth and development of this microorganism under the existing conditions (Figure (16)).
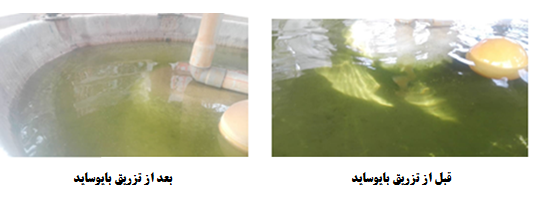
Figure (14): Controlling algae growth using biocide 0085
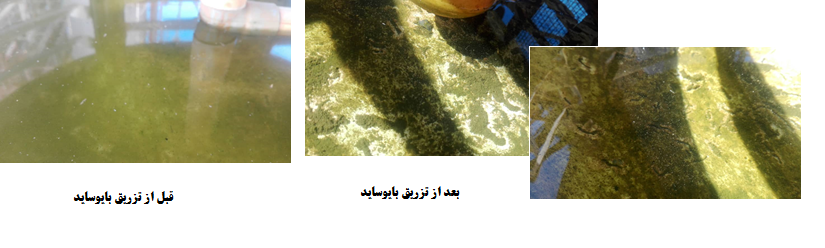
Figure (16): Controlling algae growth using biocide 0096
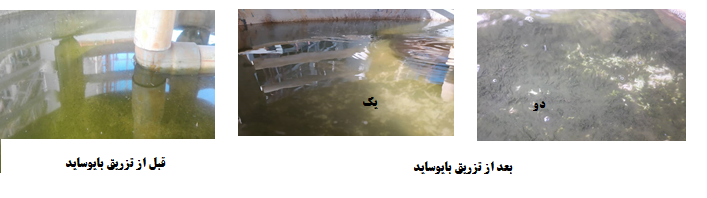
Figure (16): Controlling algae growth using biocide 0096
3- Comparison of the results of DM water analysis with the model obtained from the cooling water calculations and their permissible range
A comparison of the results of DM water analysis (compensated and circulating) of the cooling tower was also made, which showed that the results obtained from the water analysis during the test process were within the permissible range (standard range) and there was no problem in the biocide performance.
4- pH changes in the presence and absence of biocide and the effect of pH on the performance of biocide
The pH changes in the presence and absence of biocides were also examined (Figure (17)). As can be seen, for example, the pH value decreased very slightly with the increase in biocide 0085 (of course, it is in the neutral range and has not exceeded the neutral range), which can be attributed to the interaction (interaction) between the water in the cooling tower circuit and the surrounding atmosphere. Also, this biocide had an increasing reaction rate in the pH range of 4 to 9. These slight changes in the environment over time could indicate the stability of the reaction product in the aqueous environment.
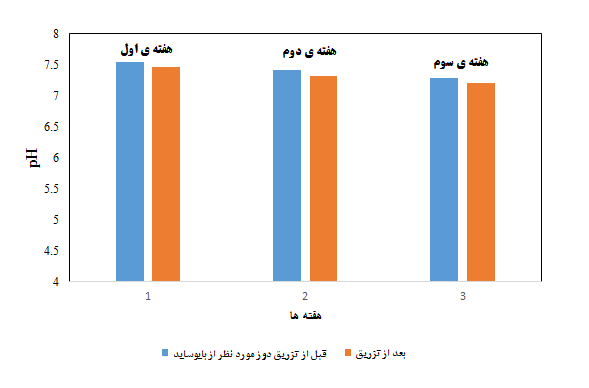
Figure (17): Changes in pH in the environment over time
The effect of pH on biocide activity and reactivity is also given in Table (1). Its rate of interaction with proteins and enzymes at neutral-alkaline pH is much higher than at acidic pH. The cross-linking mechanism of the biocide is also effective with time, concentration and temperature.
Table (1): Microbiocidal activity of 0085
Biocide form | Approximate pH value | Fungal activity | Viral activity | Bacterial activity |
Acidic | 4-5 | Low | Low to high | Low |
Neutral-alkaline | 7-8 | A lot | A lot | A lot |
Conclusion:
In general, cooling towers (for example, pilot cooling towers) play an important role in the process and their proper operation and efficiency increase the level of productivity and reduce additional costs. Especially in the hot seasons of the year and if the tower is not in operation or its efficiency and efficiency decrease, many problems arise. Accordingly, maintaining and monitoring the water quality of the cooling tower is very necessary.
Injecting appropriate chemicals, considering the nature of the feed water and make-up water, is one of the effective methods of preventing the occurrence of basic problems of cooling towers, especially algae formation and biological corrosion, which increases the efficiency of the cooling tower and reduces its maintenance costs.
Accordingly, the number of colonies and the presence of sulfate-reducing bacteria in the DM water environment with and without the presence of 3 biocide solutions were examined and compared. Also, the condition of algae and their growth control were observed and studied to examine the optimal performance of the biocide from the start of its injection.
The results showed that the number of colonies (TBC) in the DM water environment was reduced to less than 10 when using the 0096 biocide solution in three times, which is the removal of almost 100% of bacteria in the presence of the biocide in the DM water environment and the unique performance of this solution. Therefore, the use of the biocide as a solution for controlling the growth of bacteria and algae and inhibiting biological corrosion has resulted in the removal of almost 99% of sulfate-reducing bacteria.
The effectiveness of this biocide at a given concentration was expressed as the log reduction of microorganisms after a specific contact time of 5log for TBC, which indicates the removal of almost 100% of aerobic bacteria using this biocide. In addition, the removal of more than 99% of sulfate-reducing anaerobic bacteria was also determined by testing this biocide, which shows its efficiency and effect in controlling the growth of these microorganisms well. In addition to all that has been said for biocide 0096, several advantages of biocides 0085 and 0083 can also be mentioned, including low toxicity and biocompatibility for the former and a 99.9% reduction in sulfate-reducing bacteria for the latter (Tables (8) and (11)).
Therefore, this field pilot and the results obtained in the presence and absence of biocide in the environment and the review of multiple daily and weekly tests show the optimal performance of the biocide solution in controlling the growth of microorganisms.
Table (2): Physical properties of water in the cooling tower before the addition of biocide 0085
Row | Parameter | Amount | Unit |
1 | pH | 55/7 | - |
2 | Electrical conductivity | 406 | µs/cm |
3 | Total hardness (TH) | 100 | ppm |
4 | Total dissolved solids (TDS) | 203 | ppm |
5 | Fe2+ | 5/0 | ppm |
6 | Temperature | 9/19 | ℃ |
7 | TBC | 105 | CFU/ml |
8 | SRB | 100-1000 | CFU/ml |
Table (3): Chemical analysis of water after injection of appropriate dose of biocide 0085 in the first week of injection
Parameter type | First day | Second day | Third day | Day Four | Day five | Day Six | Seventh | Eighth | |
pH | --- | 64/7 | 46/7 | 55/7 | - | 22/7 | - | 46/7 | 28/7 |
Total hardness (TH) | ppm | 100 | 90 | 80 | - | 60 | - | 60 | 60 |
Total dissolved solids (TDS) | ppm | 4/166 | 2/154 | 3/121 | - | 1/101 | - | 2/80 | 5/46 |
Electrical conductivity | µs/cm | 332 | 320 | 352 | - | 261 | - | 151 | 6/92 |
Fe2+ | ppm | 3/0 | 23/0 | 2/0 | - | 2/0 | - | - | 23/0 |
TBC | Cfu/mL | - | - | 104 | - | - | - | - | - |
SRB | Cfu/mL | - | - | - | - | 10-100 | - | - | - |
Temperature | ℃ | 4/22 | 5/22 | 2/22 | - | 5/22 | - | 8/22 | 20 |
Amount of make-up water () | Lit | 30 | 30 | 30 | - | 30 | - | 30 | 30 |
Table (4): Chemical analysis of water after injection of appropriate dose of biocide 0085 in the second week of injection
Parameter type | First day | Second day | Third day | Day Four | Day five | Day Six | Seventh | Eighth | |
pH | --- | 11/7 | 1/7 | 55/7 | - | 3/7 | - | 5/7 | - |
Total hardness (TH) | ppm | - | 45 | 12 | 12 | 10 | - | 10 | - |
Total dissolved solids (TDS) | ppm | 56 | 1/43 | 1/40 | 40 | 40 | - | 32 | - |
Electrical conductivity | µs/cm | 1/101 | 1/87 | 80 | 2/78 | 1/75 | - | 76 | - |
Fe2+ | ppm | 1/0 | 1/0 | 2/0 | 1/0 | 1/0 | - | 2/0 | - |
TBC | Cfu/mL | - | - | 103 | - | - | - | - | - |
SRB | Cfu/mL | - | - | - | - | - | - | 1-10 | - |
Temperature | ℃ | 9/22 | 1/22 | 8/22 | 22 | 5/22 | - | 8/22 | - |
Amount of make-up water | Lit | 30 | 30 | 30 | 30 | 30 | - | 30 | - |
Table (5): Chemical analysis of water after injection of appropriate dose of biocide in the third week of injection
Parameter type | First day | Second day | Third day | Day Four | Day five | Day Six | Seventh | Eighth | ||||||||||
pH | --- | 34/7 | 01/7 | - | 11/7 | - | - | - | - | |||||||||
Total hardness (TH) | ppm | 10 | 12 | - | 11 | 12 | - | - | - | |||||||||
Total dissolved solids (TDS) | ppm | 35 | 4/30 | - | 01/30 | 2/28 | - |
- | - | |||||||||
Electrical conductivity | µs/cm | 2/70 | 1/67 | - | 65 | 2/71 | - | - | - | |||||||||
Fe2+ | ppm | 1/0 | 1/0 | - | 2/0 | 23/0 | - | - | - | |||||||||
TBC | Cfu/mL | - | 102 | - | - | - | - | - | - | |||||||||
SRB | Cfu/mL | - | - | - | - | - | - | - | - | |||||||||
Temperature | ℃ | 9/22 | 1/22 | -- | 22 | 12/23 | - | - | - | |||||||||
Amount of make-up water | Lit | 30 | 30 | - | 30 | 30 | - | - | - | |||||||||
Table (6): Physical properties of water inside the cooling tower before adding biocide 0083
Row | Parameter | Amount | Unit |
1 | pH | 645/9 | - |
2 | Electrical conductivity | 5/82 | µs/cm |
3 | Total hardness (TH) | 30 | ppm |
4 | Total dissolved solids (TDS) | 1/40 | ppm |
5 | Fe2+ | 2/0 | ppm |
6 | PO43- | 56/2 | ppm |
7 | Temperature | 6/22 | ℃ |
8 | TBC | 106 | CFU/ml |
9 | SRB | 100-1000 | CFU/ml |
Table (7): Chemical analysis of water after injection of appropriate dose of biocide in the first week of injection 0083
Parameter type | First day | Second day | Third day | Day Four | Day five | Day Six | Seventh day | |
pH | --- | 047/7 | - | - | - | - | 96/7 | - |
Total hardness (TH) | ppm | 74 | - | - | - | - | 20 | - |
Total dissolved solids (TDS) | ppm | 8/87 | - | - | - | - | 8/47 |
- |
Electrical conductivity | µs/cm | 6/176 | - | - | - | - | 6/95 | - |
Fe2+ | ppm | 3/0 | - | - | - | - | 0/0 | - |
PO43- | ppm | - | - | - | - | - | 05/0 | - |
TBC | Cfu/mL | - | 106 | - | - | - | - | - |
SRB | Cfu/mL | -- | - | - | - | - | 100-1000 | - |
Temperature | ℃ | 1/22 | - | - | - | - | 4/27 | - |
Amount of make-up water () | Lit | 30 | 30 | 30 | -30 | 30 | 30 | 30 |
Table (8): Chemical analysis of water after injection of appropriate dose of biocide in the second week of injection 0083
Parameter type | First day | Second day | Third day | Day Four | Day five | Day Six | Seventh | |||||||||
pH | --- | 88/6 | - | - | 1/8 | - | ||||||||||
Total hardness (TH) | ppm | 8/0 | - | - | 100 | - | ||||||||||
Total dissolved solids (TDS) | ppm | 07/10 | - | - | 3/98 | - | ||||||||||
Electrical conductivity | µs/cm | 1/20 | - | - | 65/19 | - | ||||||||||
Fe2+ | ppm | 0/0 | - | - | 0/0 | - | ||||||||||
PO43- | ppm | 069/0 | - | - | -- | - | ||||||||||
TBC | Cfu/mL | - | 104 | - | - | - | ||||||||||
SRB | Cfu/mL | - | - | - | - | - | 10/100 | |||||||||
Temperature | ℃ | 1/25 | - | - | 9/27 | - | ||||||||||
Amount of make-up water | Lit | 30 | 30 | 30 | 30 | 30 | 30 | 30 | ||||||||
Table (9): Chemical analysis of water after injection of appropriate dose of biocide in the third week of injection 0083
Parameter type | First day | Second day | Third day | Day Four | Day five | Day Six | Seventh | |
pH | --- | 96/7 | - | - | - | - | - | 74/7 |
Total hardness (TH) | ppm | 00/52 | - | - | - | - | - | 80 |
Total dissolved solids (TDS) | ppm | 5/94 | - | - | - | - | - | 7/76 |
Electrical conductivity | µs/cm | 00/19 | - | - | - | - | - | 4/158 |
Fe2+ | ppm | 0/0 | - | - | - | - | - | 3/0 |
PO43- | ppm | -- | - | - | - | - | - | 55/0 |
TBC | Cfu/mL | - | 103> | - | - | - | - | - |
SRB | Cfu/mL | - | - | - | - | - | - | 10-100 |
Temperature | ℃ | 0/26 | - | - | - | - | - | 6/24 |
Amount of make-up water | Lit | 30 | ||||||
Table (10): Physical properties of water in the cooling tower before adding biocide 0096
Row | Parameter | Amount | Unit |
1 | pH | 64/8 | - |
2 | Electrical conductivity | 8/98 | µs/cm |
3 | Total hardness (TH) | 40 | ppm |
4 | Total dissolved solids (TDS) | 2/49 | ppm |
5 | Fe2+ | trace | ppm |
6 | PO43- | 2/0 | ppm |
7 | Temperature | 3/28 | ℃ |
8 | TBC | 106 | CFU/ml |
9 | SRB | 10000 | CFU/ml |
Table (11): Chemical analysis of water after injection of appropriate dose of biocide 0096 in the first week of injection
Parameter type | First day | Second day | Third day | Day Four | Day five | Day Six | Seventh day | Eighth | Ninth | Tenth | |
pH | --- | 64/8 | - | - | - | - | - | 12/8 | - | - | - |
Total hardness (TH) | ppm | 40 | - | - | - | - | - | 45 | - | - | - |
Total dissolved solids (TDS) | ppm | 2/49 | - | - | - | - | - | 2/61 | - | - | - |
Electrical conductivity | µs/cm | 8/98 | - | - | - | - | - | 2/110 | - | - | - |
Fe2+ | ppm | trace | - | - | - | - | - | 12/0 | - | - | - |
PO43- | ppm | 2/0 | - | - | - | - | - | 05/0 | - | - | - |
TBC | Cfu/mL | - | 104 | - | - | - | - | - | - | - | - |
SRB | Cfu/mL | - | 1000-10000 | - | - | - | - | - | - | - | - |
Temperature | ℃ | 3/28 | - | - | - | - | - | 28 | - | - | - |
Amount of make-up water () | Lit | - | - | ||||||||
Table (12): Chemical analysis of water after injection of appropriate dose of biocide 0096 in the second week of injection
Parameter type | First day | Second day | Third day | Day Four | Day five | Day Six | Seventh | Eighth | Ninth | |
pH | --- | 39/8 | - | - | - | - | - | 88/7 | - | - |
Total hardness (TH) | ppm | 52/0 | - | - | - | - | - | 100 | - | - |
Total dissolved solids (TDS) | ppm | 4/81 | - | - | - | - | - | 9/129 | - | - |
Electrical conductivity | µs/cm | 3/146 | - | - | - | - | - | 0/259 | - | - |
Fe2+ | ppm | 1/0 | - | - | - | - | - | 4/0 | - | - |
PO43- | ppm | trace | - | - | - | - | - | 693/0 | - | - |
TBC | Cfu/mL | - | <103 | - | - | - | - | - | - | - |
SRB | Cfu/mL | - | - | - | 100-1000 | - | - | - | - | - |
Temperature | ℃ | 28 | - | - | - | - | - | 3/28 | - | - |
Amount of make-up water | Lit | |||||||||
Table (13): Chemical analysis of water after injection of appropriate dose of biocide 0096 in the third week of injection
Parameter type | First day | Second day | Third day | Day Four | Day five | Day Six | Seventh | Eighth | Ninth | Tenth | |
pH | --- | 66/8 | - | - | - | - | - | - | - | - | 83/7 |
Total hardness (TH) | ppm | 40 | - | - | - | - | - | - | - | - | 6/67 |
Total dissolved solids (TDS) | ppm | 7/103 | - | - | - | - | - | - | - | - | 94 |
Electrical conductivity | µs/cm | 3/213 | - | - | - | - | - | - | - | - | 186 |
Fe2+ | ppm | 1/0 | - | - | - | - | - | - | - | - | 0/1 |
PO43- | ppm | trace | - | - | - | - | - | - | - | - | 372/0 |
TBC | Cfu/mL | - | <10 | - | - | - | - | - | - | ||
SRB | Cfu/mL | - | - | - | - | - | 10-100 | - | - | - | - |
Temperature | ℃ | 2/32 | - | - | - | - | - | - | - | - | 27 |
Amount of make-up water | Lit | ||||||||||
compartir :
¿Por qué los sistemas industriales necesitan anticongelante/refrigerante en verano?
1405/03/02Pasos para la limpieza química de torres de refrigeración: guía de implementación
1405/02/07Tipos de sedimentos en sistemas de ósmosis inversa y métodos para identificarlos.
1405/02/05Beneficios de utilizar soluciones especializadas de Abrizan Company para MED
1404/12/09
Artículos relacionados

Biocides and their types
Biocides are chemical or natural compounds used to kill, inhibit, or prevent the growth of living organisms such as bacteria, fungi, viruses, insects, and other organisms. This article provides a comprehensive review of biocides, their types, mechanisms of action, factors affecting the duration of effect, applications, and challenges in the use of biocides.
bacterias reductoras de sulfato
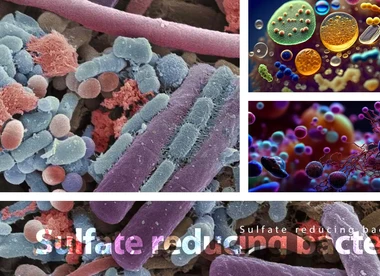
La corrosión causada por bacterias reductoras de sulfato se descubrió por primera vez en los Países Bajos en 1934. Las bacterias reductoras de sulfato, abreviadas como SRB, viven en ambientes acuáticos, en las profundidades del subsuelo y en los mares, donde el oxígeno disuelto es mínimo.
Envía tu opinión
Tu dirección de correo electrónico no será publicada.